OEE Measurement made Simple
Quick Explanation on OEE
Overall Equipment Effectiveness is a measurement used by the manufacturing industry to monitor the percentage of equipment time that is productive (making good and sellable products). The measurement can be done on individual machines, or a group of machines within the same process. However, it is most useful when OEE is tracked and analyzed for the bottleneck process, because improving that means an overall improvement to the line throughput.
The inverse of OEE is then a percentage representing the overall Production Losses. This is the number that tells us how much time we are spending to create defects, or not running the equipment due to downtime.
Many manufacturers today measure their production performance through output quantities and product yields. Although these will show the factory’s performance, it does not help identify and breakdown the underlying losses. OEE, when implemented correctly, can help identify these losses and drive improvement actions.
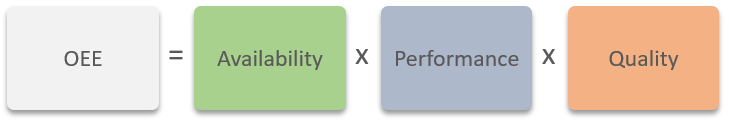
To get OEE, we need to first calculate the 3 factors – A, P & Q.
Availability
Availability is calculated from Downtime, where we need record down how much time the equipment is running and not running during the Planned Production Time. Apart from just getting data that indicating equipment uptime and downtime, it is important to also indicate down the reasons categorized into Planned Downtime, and Unplanned Downtime. This will help manufacturing Engineers to understand where they should focus the improvements on.
Performance
Performance is calculated from the product manufacturing cycle time, along with short downtimes that are too tedious to be recorded under Availability. By taking away Downtime from the Planned Production Time, we get the remaining time where production is expected to produce a target quantity based on the manufacturing cycle time. The deviation of this target is our Performance percentage.
Quality
Quality is the most straightforward calculation. It is basically the quantity of good products over the total number of product produced.
This is similar to product yield, however for product yield we measure the percentage of good products at the end of the production line. While for the Q in OEE, we measure per equipment. The resulting values can be different especially for process that involves reworking defects.
How AlphaDES Captures OEE Data
Before data entry, the Engineer should understand what kind of defects and downtimes can potentially take place in the production lines. These, along with other master configuration data, will need to be setup under the Administrator module.
- Creating Processes and Stations
- Creating Part Numbers – Revision, Process Routing, Cycle Time.
- Creating Defects Categories for each process.
- Creating Downtime Categories for each process.
AlphaDES supports data entry of both serialized (where each product has a serial number) and lot-based production (where products are processed in bulk tied to a lot traveler). Although the data entry interfaces are slightly different for each case, they are both capable to store the same data to measure OEE. Both data entry types can also be used concurrently in the same factory.
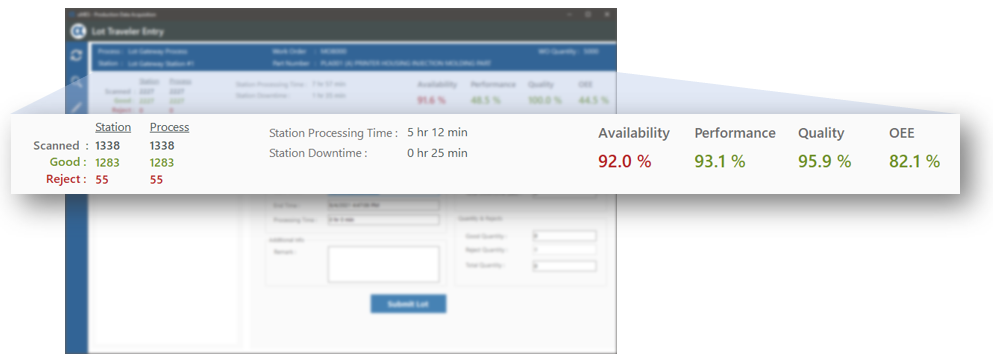
During data entry, the following information is captured either through automatic calculation, or keyed in by the operator:
- Station Processing Time (this is equivalent to Planned Production Time).
- Quantities – Good, Reject and Total quantities.
- Downtimes – Planned, Unplanned, Reasons, entered in minutes.
- Defects – Defect mode and quantities.
As data is being submitted during the course of production, AlphaDES calculates and refreshes the real-time OEE for that station. This way, supervisor is provided a visual indicator of the station’s performance when he/she walks the line.
OEE Reports & Dashboards
There are several built-in reports and dashboard visuals that help to aggregate OEE data into useful analytics. You have the option to select a specific time period grouped daily, weekly or monthly. You can filter a specific process or a specific machine. You are also able to export the data in Excel spreadsheets to do additional processing outside of AlphaDES.

The screenshot shows a typical daily OEE chart for an inspection station utilizing an inspection equipment.
A, P, Q and OEE chart series can be plotted individually.
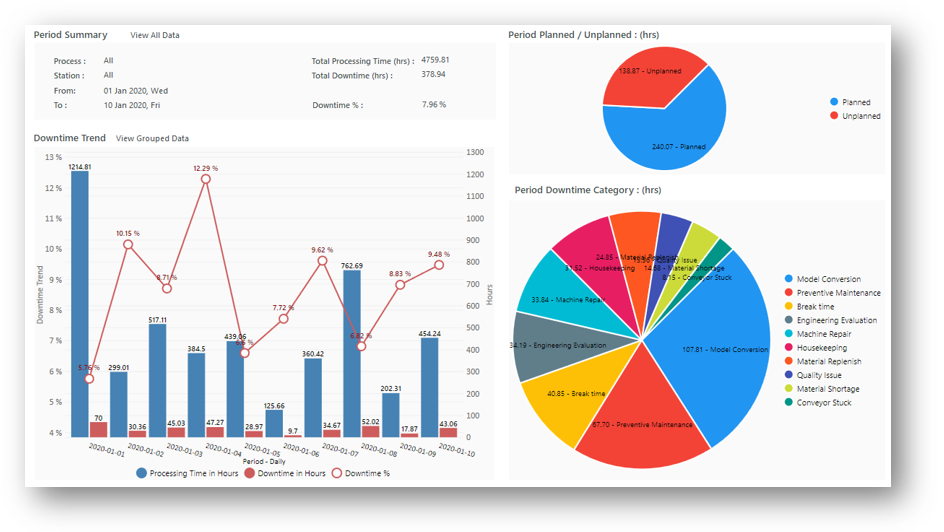
A report that visualizes the Downtime trend, the ratio of Planned vs Unplanned Downtime, and the breakdown of Downtime Categories.

For users who prefer to use the Dashboard to monitor production. Several visuals are available to display the OEE performance such as :
- OEE gauge with target lines.
- OEE trend chart.
- Downtimes breakdown.
- Defects breakdown.
- Output trend chart.
To understand more about how AlphaDES can help improve your OEE monitoring, please feel free to get in touch with us.