Visualize your data in real-time dashboards
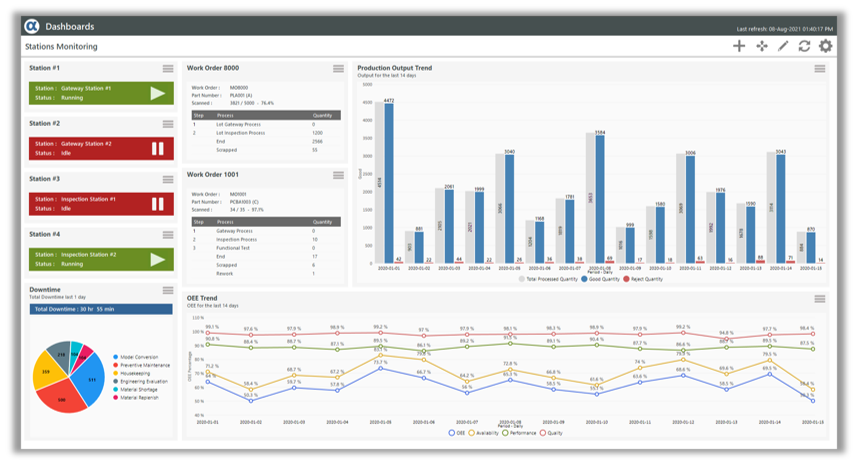
Dashboard Visuals
- Monitor OEE trends
- Aggregated OEE gauges.
- Production output vs rejects.
- Control charts
- Rejects breakdown
- Downtime breakdown
- Custom web content
- Station real-time status
- Work Order WIP status
- Custom text label
Visualize Your Manufacturing Data
Everyone can build Dashboards with a few clicks
We designed this tool in a way that users from any level in the operation team can create their own dashboards whenever they need to look at data from a different perspective. Production dashboards can be used as real-time performance displays around the production floor, or simply as someone’s personal reporting tool for his/her weekly management meeting.
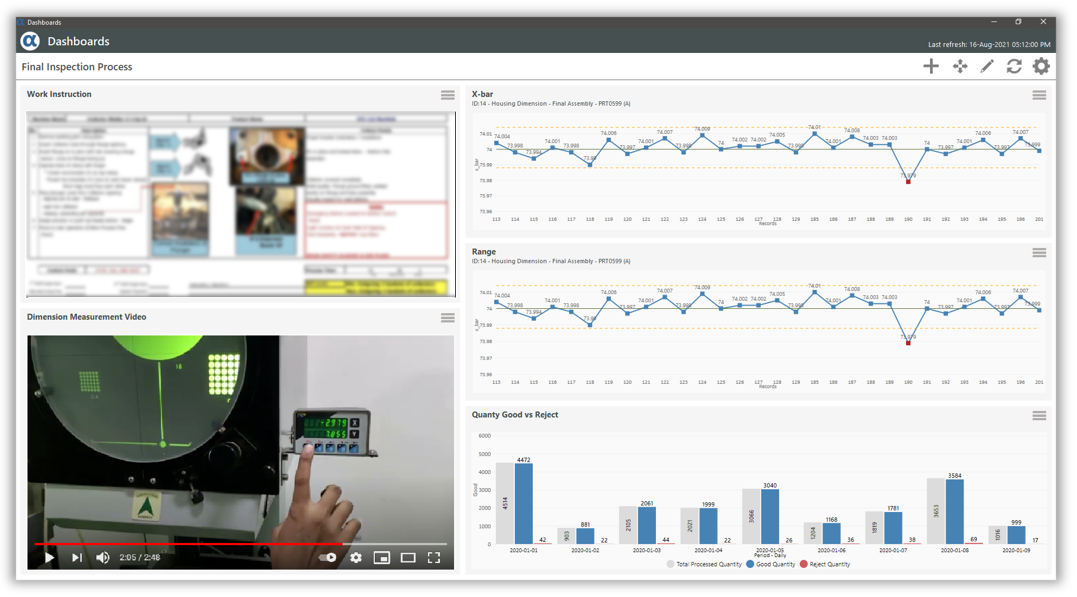
Unlimited Possibilities
Practically endless ways to pin your visuals
Visuals from different modules can be placed in the same Dashboard to provide a single overview of all data you care about. Apart from charts and tables, users can use the rich media visual to place custom contents such as documents, videos and webpages along side with other data.
To understand more about AlphaDES Dashboard features, please feel free to get in touch with us.