Keep your process under control
AlphaDES, also available as a standalone module AlphaSPC, allows users to create Inspection Plan for measurement data acquisition. This is particularly useful for manufacturers relying on traditional measurement devices.
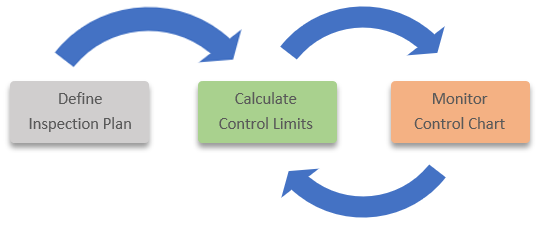
SPC is executed in 3 phases in AlphaDES.
1. Defining the Inspection Plan that includes the following information:
- Aspects to be measured, such as dimensions, weights, frequency, etc.
- Size of Subgroup (number of samples to measure per inspection)
- Nominal, Upper/Lower Specification Limits (USL, LSL)
- Upper/Lower Control Limits (UCL, LSL) – more on this next.
2. Defining the Control Limits by calculating from a set of measurement data collected over the initial production run. Traditionally, Process Engineers who are trained in SPC will define the size of the data required to properly calculate the estimated standard deviation and control limits using statistical software such as MiniTab.
This manual manipulation of data using 3rd party software is no longer required since AlphaDES can automatically calculate the Control Limits for the user.
3. Monitor the process using Control Charts. By recording the measurement data, user can view the Control Charts directly in AlphaDES with no side calculation required.
AlphaDES supports the following Control Charts based on the subgroup size defined in the Inspection Plan.
- X_bar / R – for subgroup size 2 to 9
- X_bar / s – for subgroup size 10 and above
- X / MR – for subgroup size 1
The above is only applicable for Variable Data. Currently AlphaDES does not support Attribute Data Type.
After a certain production period – around 2 weeks or up to 3 months, or a process or equipment change, the Control Limits need to be reviewed again to ensure the process is controlled within an acceptable limit.
Control Charts
Control Charts can be viewed just by selecting an Inspection Plan defined for a Part Number and Process. With auto refreshing feature, the Control Charts can be displayed beside the equipment for real-time process control and monitoring. The control charts can also be inserted into a custom Dashboard to be merged with other production visuals on the same screen. Subgroup data, as well as raw measurement data can be exported into Excel spreadsheets for external processing.
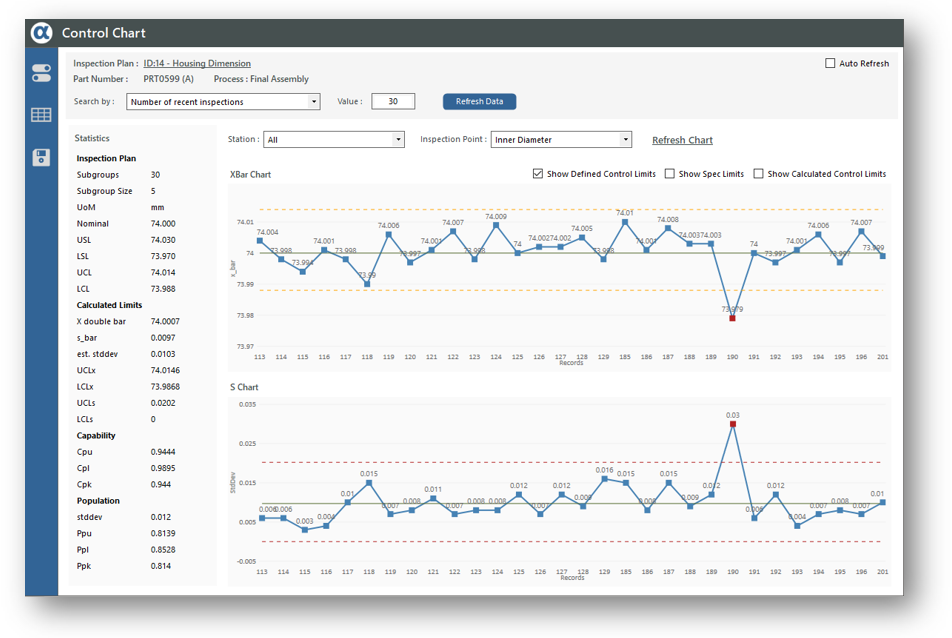
A typical X_bar / s Control Chart for a plastic housing dimension measurement.
Left part of the screen is a list of calculated statistics based on the selected number of measurement subgroups, along with the estimated standard deviation and calculated control limits.
At the central zone are the Control Charts indicating the subgroup’s averages and standard deviation, plotted in series with the control limits. Out-of-control points are clearly marked in the chart to trigger improvement actions.
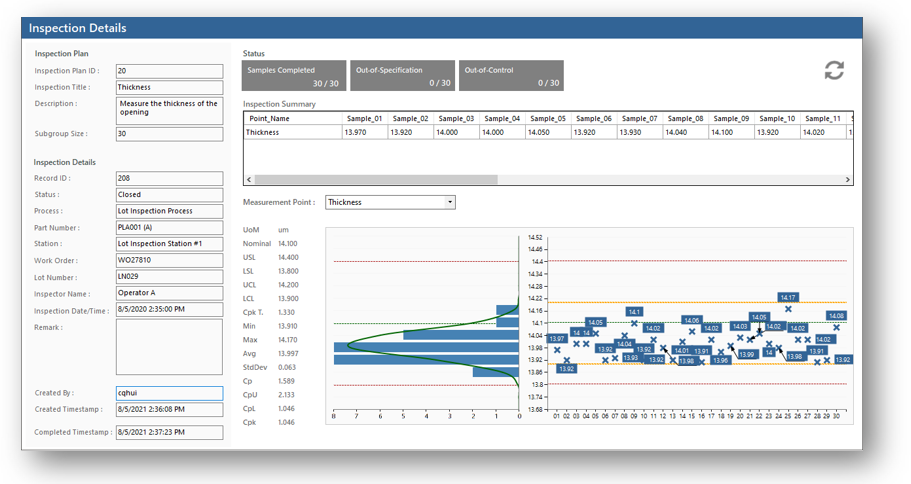
User can also drill down to a subgroup. The screenshot shows the inspection details, the measured values of every sample, the calculated statistics and distribution charts for one subgroup of measurement data.
To understand more about how AlphaDES can help improve SPC, please feel free to get in touch with us.